另外单独的XLF分析,传统j技术分析方法。
Take a look at the weekly chart first: 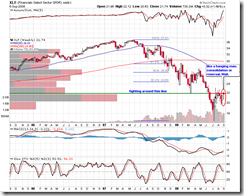
Now
it is range bounding, and the previous trend is downward, so we cannot
confirm it is bullish at the moment. The candlestick pattern of the
past two weeks looks like a hanging man, which is a consolidation or
bearish reversal. We need to wait for the confirmation. The chart
also shows that bulls and bears are fighting around $22 line, and a
decisive breakout above 22 or under 20 will be a clear signal to the
next trend. How is the long term trend then? Here is the P&F chart: 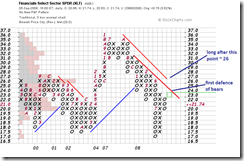
The
chart shows that the first defense of bears is at 23. Breakout above
23 will corner bears to retreat to 26. Bears will be defeated once XLF
closes above 26 decisively. Now look at the daily chart: 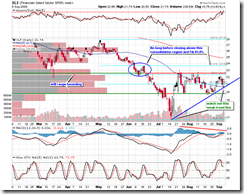
Firstly,
XLF is still bounded in a range between 20- and ~22.5. Next, note that
the range between Fib 50% and Fib 61.8% is a previous consolidation
zone. The volume within this region is quite heavy, so I expect XLF
consolidates for an extended period. Closing above 23.7 will mean the
trend is strong and the bearish trend has been reversed. We can also
see a new trendline but it can be broken easily without any meaning.
In my opinion, MA(50) seems like a support but it doesn't mean anything
either, maybe it could provide some hope to bulls. How is SKF -- the UltraShort Financials -- doing? Just take a look at a simple P&F chart: 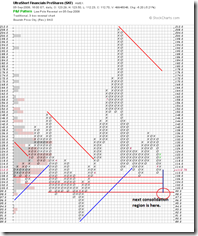
Remember
to disregard the price objective because I don't think it makes any
sense. On the chart, 108 looks like a good support, but it has been
broken during the after-hour trading. Then it may go straight down to
104 and 99. Depending on how XLF goes, the next reversal point will be
likely between 97--99.
| 
 狗仔卡
狗仔卡 发表于 2008-9-5 04:30 PM


 还有个问题请教一下, 这两都是double的,skf $211 的时侯 uyg $14, 现在一个106 一个23,(AH) 好像不是很对称, 当时如果各买相同的金额,好像有的赚。很奇怪!


