找回密码
 注册
搜索
查看: 3119|回复: 23

[转贴] Renko Mechanical System

[复制链接]
发表于 2009-3-10 06:55 PM | 显示全部楼层 |阅读模式


Renko Chart Definition:

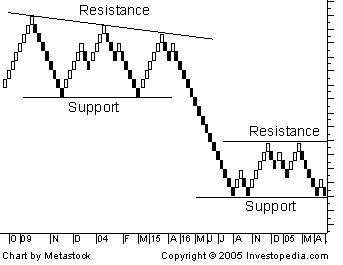
A Renko style chart is a type of chart, developed by the Japanese, that is only concerned with price movement; time and volume are not included. It is thought to be named for the Japanese word for bricks, "renga". A renko chart is constructed by placing a brick in the next column once the price surpasses the top or bottom of the previous brick by a predefined amount. White bricks are used when the direction of the trend is up, while black bricks are used when the trend is down. This type of chart is very effective for traders to identify key support/resistance levels. Transaction signals are generated when the direction of the trend changes and the bricks alternate colors. Renko charts work in a similar way as Point & Figure charts, however they are easier to read and follow.

Example chart:
Renko Mechanical Trading System:

One of the most difficult things about trading (if not the most difficult) is controlling one's emotion. There are a vast number of books written on technical analysis and the study of chart patterns, and these are important, however it is emotion that is often the most difficult to control or master for many traders. Mechanical systems that have hard-set rules for buy/sell signals, take away the emotion that makes trading so difficult.


Renko System Overview:

Renko charts are very effective at defining support/resistance clearly and they ignore a lot of 'noise' that often occampanies normal candlestick charts. However Renko charts can be subject to noise, and in order to mitigate this noise, I have a serious of indicators that I employ in order to generate reliable mechanical buy/sell signals.

Buy/sell signals:

1.) 7 day EMA - you need to see the candles close either above or below this MA, this is a guide, not a buy/sell in itself unless combined with other indicators

2.) The 14,3 period Stochastics works very well via crossovers. Buy/Sell signals generally need to be confirmed via the Stochastics crossing below 80% or above 20%

3.) Buy/Sell signals MUST have a Parabolic Sar buy/sell signal. I use a PSAR setting of (0.09,0.2).

4.) I like to use a MACD Histogram with a 5 EMA to look for divergences.

5.) Putting it all together: Buy/Sell signals must be confirmed via a PSAR siganl, Stochastics crossover, and a crossover of the 7 EMA - this combination eliminates many whipsaws.

The Renko systems seems to be very good at keeping you in the majority of a major trend and at the same time keeping your losses small. Yes the system will produce whipsaws, however the whipsaws are generally more than made up when you catch a strong trend.

Below are chart examples


Below are examples of charts using the Renko style of charts along with my indicators; buy and sell signals are noted via the blue arrows. You can also see that I indicator the net gain and loss with each signal, as you can see, the Renko charts work pretty well...


Disclaimer - please note:

One last thing that I must point out before you get too excited: This system, while it looks impressive, IS NOT the end all magic system. I've noticed that it works great on some charts and stocks, especially when thy trend, however sometimes it doesn't work very well depending on the stock or market index. Therefore check to see if the stock or index you want to trade has been working with with the Renko chart. And always, remember that you are looking at past data and just because it worked well in past for a particular stock/index, doesn't mean that it will continue to. Again the Renko charts are not magic, however they appear to be a useful tool to have in one's arsenal. The nice thing about the system is that it has its own built in stop loss i.e. your stop loss is basically the next signal.

Use Money Management & Common Sense!

One more thing, you must use proper money management just you do for your normal trading. For example, don't 'back up the truck' and go out full margin, use common sense. If you normally put 5% - 10% of your money in a particular stock, then do the same with a mechanical system.

Have fun!!

发表于 2009-3-10 06:59 PM | 显示全部楼层
哎,这个没用,可能最早还是俺先介绍出来的。问题出在ATR上面(每个棒棒都是一个ATR单位),因为ATR随时会变的,所以你现在看到的信号,过两天就变了,这在上下波动很大的情况下,死俏俏。
回复 鲜花 鸡蛋

使用道具 举报

 楼主| 发表于 2009-3-10 07:04 PM | 显示全部楼层
哎,这个没用,可能最早还是俺先介绍出来的。问题出在ATR上面(每个棒棒都是一个ATR单位),因为ATR随时会变的,所以你现在看到的信号,过两天就变了,这在上下波动很大的情况下,死俏俏。
Cobra 发表于 2009-3-10 07:59 PM


比较适合新手用吧,如果入点找准了,不容易被震出来吧!
回复 鲜花 鸡蛋

使用道具 举报

发表于 2009-3-10 07:16 PM | 显示全部楼层
i like it
回复 鲜花 鸡蛋

使用道具 举报

发表于 2009-3-10 07:20 PM | 显示全部楼层
谢谢酷老大,学习中.
适合青蛙.呵呵.
回复 鲜花 鸡蛋

使用道具 举报

发表于 2009-3-10 07:23 PM | 显示全部楼层
比较适合新手用吧,如果入点找准了,不容易被震出来吧!
CoolMax 发表于 2009-3-10 20:04


你没明白我的意思,是这个系统不是固定的,因此Back test是不准的。理由是ATR在上下波动很大的情况下变化会很大,这样图上显示的红棒棒,白棒棒的数量是每天变化的,所以你今天也许看着是买信号,过两天就变成卖信号了,因此是没法follow的。当然你可以说市场不总是上下波动很大,问题是既然有那么大的例外,那这个系统就是不可靠的。
回复 鲜花 鸡蛋

使用道具 举报

发表于 2009-3-10 07:28 PM | 显示全部楼层
比较适合新手用吧,如果入点找准了,不容易被震出来吧!
CoolMax 发表于 2009-3-10 16:04


哈哈。。。 一天在胡同泡着, 想不被震出来?? 难!
回复 鲜花 鸡蛋

使用道具 举报

发表于 2009-3-10 07:28 PM | 显示全部楼层
not perfect trading system, as long as it's simple and easy for winning trade, that's good.
回复 鲜花 鸡蛋

使用道具 举报

发表于 2009-3-10 07:33 PM | 显示全部楼层
你没明白我的意思,是这个系统不是固定的,因此Back test是不准的。理由是ATR在上下波动很大的情况下变化会很大,这样图上显示的红棒棒,白棒棒的数量是每天变化的,所以你今天也许看着是买信号,过两天就变成卖 ...
Cobra 发表于 2009-3-10 20:23


蛇老大,那么point & figure图是不是更好一点。
回复 鲜花 鸡蛋

使用道具 举报

发表于 2009-3-10 07:38 PM | 显示全部楼层
not perfect trading system, as long as it's simple and easy for winning trade, that's good.
benmao 发表于 2009-3-10 20:28


我的意思是说,这个不能做为系统,你看到的信号,明天说不定就不存在了,因为作为这个系统的最基本单位,每天都在变化。
回复 鲜花 鸡蛋

使用道具 举报

发表于 2009-3-10 07:38 PM | 显示全部楼层
蛇老大,那么point & figure图是不是更好一点。
oldfairy 发表于 2009-3-10 20:33


当年没好好学。
回复 鲜花 鸡蛋

使用道具 举报

发表于 2009-3-10 07:43 PM | 显示全部楼层
i agree with cobra on some points. renko chart is a good one, but usually people will also look at other charts/signals as well.

thanks for reminding. ;-)
回复 鲜花 鸡蛋

使用道具 举报

发表于 2009-3-10 08:39 PM | 显示全部楼层
How about using a fixed point instead of ATR?
回复 鲜花 鸡蛋

使用道具 举报

发表于 2009-3-10 09:11 PM | 显示全部楼层
How about using a fixed point instead of ATR?
bucks 发表于 2009-3-10 21:39


总算有个看明白的了。你可以自己试试啊。Renko有两种设定,ATR or Points,问题是设多少points,每个不同的股票有不同的特性啊,你只能针对某个股票定制一个系统,这样,这篇文章讲的信号就都不能用了。
回复 鲜花 鸡蛋

使用道具 举报

发表于 2009-3-10 09:18 PM | 显示全部楼层
well, i have different renko setting for each stock i like to watch
回复 鲜花 鸡蛋

使用道具 举报

发表于 2009-3-10 09:23 PM | 显示全部楼层
没有包罗万象的系统, 每个个股都有它自个的股性...
回复 鲜花 鸡蛋

使用道具 举报

发表于 2009-3-10 11:02 PM | 显示全部楼层
老大,用points设定做DT还行。主要是要把时间设置合适了。1分钟可能会产生太多噪音, 5分钟图会好看些,但是real-time操作时要小心,因为在5分钟内出现的信号,可能转眼就消失了,如果等5分钟结束后(box在图上固定后)再buy或sell,可能就错过好的buy/sell点了。就象老大说的“每个不同的股票有不同的特性”,需要个股单独对待。

daily renko chart对swing操作没有什么帮助。因为同样的道理,只有在一天close后,图形(box)才固定,intraday看的信号在market close之前随时都会消失。


总算有个看明白的了。你可以自己试试啊。Renko有两种设定,ATR or Points,问题是设多少points,每个不同的股票有不同的特性啊,你只能针对某个股票定制一个系统,这样,这篇文章讲的信号就都不能用了。
Cobra 发表于 2009-3-10 22:11
回复 鲜花 鸡蛋

使用道具 举报

发表于 2009-3-10 11:07 PM | 显示全部楼层
酷大怎么今天把breakpointtrades.com去年的旧帖子翻出来了

Renko Chart Definition:
A Renko style chart is a type of chart, developed by the Japanese, that is only concerned with price movement; time and volume are not included. It is thought to be n ...
CoolMax 发表于 2009-3-10 19:55
回复 鲜花 鸡蛋

使用道具 举报

发表于 2009-3-10 11:15 PM | 显示全部楼层
回复 鲜花 鸡蛋

使用道具 举报

 楼主| 发表于 2009-3-11 12:53 AM | 显示全部楼层
酷大怎么今天把breakpointtrades.com去年的旧帖子翻出来了


Anita 发表于 2009-3-11 12:07 AM


因为QQQ在介绍Renko System,所以我就翻翻旧帖子。Just for Heads up.
回复 鲜花 鸡蛋

使用道具 举报

您需要登录后才可以回帖 登录 | 注册

本版积分规则

手机版|小黑屋|www.hutong9.net

GMT-5, 2024-5-23 02:54 PM , Processed in 0.066921 second(s), 15 queries .

Powered by Discuz! X3.5

© 2001-2024 Discuz! Team.

快速回复 返回顶部 返回列表