|
|
http://blog.afraidtotrade.com/br ... -the-current-rally/
I’ve received quite a few responses from posting on the “Strange Similarities Between the 2007 Peak and Current Rally High” yesterday evening.
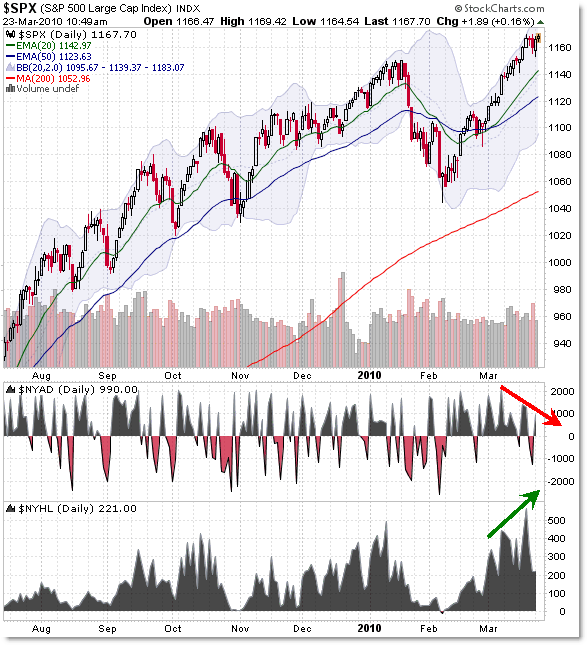
I wanted to show a chart based on a comment by a reader who highlighted that, although the price patterns were similar, the readings from internals - specifically those of the net new highs - were slightly different.
Inspired by that email, I wanted to show the charts of the 2007 and 2010 rally highs in the S&P 500 and focus on two measures of breadth or internals, as seen below:
The “NYAD” which is the standard “Advance - Decline” line and then the “NYHL” which is the New Highs minus New Lows - both on the NYSE Index.
While the internal picture looks slightly stronger now, we see the similarities extend to internals as well. Let’s take a look:
S&P 500 ‘peak’ in October 2007:

We’re still seeing a very similar Breadth (NYAD) divergence on the highs (red arrow), but we’re seeing strength and new highs in the NYHL (New Highs minus Lows).
As of the peak, roughly 550 stocks (net) were making new highs in the index, twice that of 2007 and the index was making new recovery highs (unlike the 2007 rally, as the NYHL peaked in the April to June 2007 period).
Taking all this into account, the similarities stretch into the market internal indexes shown above, from the divergence in Breadth to the rise in the NYHL index.
Keep watching the market closely and take a few moments to study these charts (and your own) for any other potential chart similarities between the two periods.
Reminder: I’ll be conducting a lunchtime Chat Q&A on Trading Tactics with the MoneyShow.com today (March 23) at 1:00 EST / 12:00 CST so stop by and join us for quick trading tips!
Information and registration here at a prior blog post.
Corey Rosenbloom, CMT
Afraid to Trade.com
We see that as the market formed its ultimate peak above 1,570, a negative breadth ($NYAD) divergence (along with a negative volume and momentum divergence as described last night) formed on the high tick prior to the market sell-off.
However, the New High minus New Lows (NYHL) index continued to rise, showing a difference of 250 stocks making new highs (net) as the market peaked.
Another difference is that the NYHL index turned sharply negative (dipping as low as -1,000) during the initial sell-off swing that broke under moving average support.
The current market dipped negative in this index for about three days only, as seen below.
S&P 500 Current (2010) Rally High:
 |
|

 狗仔卡
狗仔卡 发表于 2010-3-23 01:58 PM
 提升卡
提升卡 置顶卡
置顶卡 沉默卡
沉默卡 喧嚣卡
喧嚣卡 变色卡
变色卡 发表于 2010-3-23 02:18 PM
